
What Are People Watching?
What Are People Watching?
Media habits are constantly changing, and it can be difficult to keep track of these shifts. Often people assume, because of their own personal habits, that others consume media the same way they do. As always, facts are more powerful than assumptions.
Clearly in March 2020 most people’s visual media habits evolved, and streaming services became more pronounced in our day-to-day lives. But where viewership currently stands, now that we are returning to normalcy, has been a big question mark.
The good news is Nielsen has created a snapshot of viewing habits. This new report is The Gauge, and it’s updated monthly. Every radio sales rep should have this data in their tool belt of sales materials.
Broadcast television, once the dominant source of visual media, has fallen to third behind cable and streaming services. Only 25% of viewership is to broadcast television.
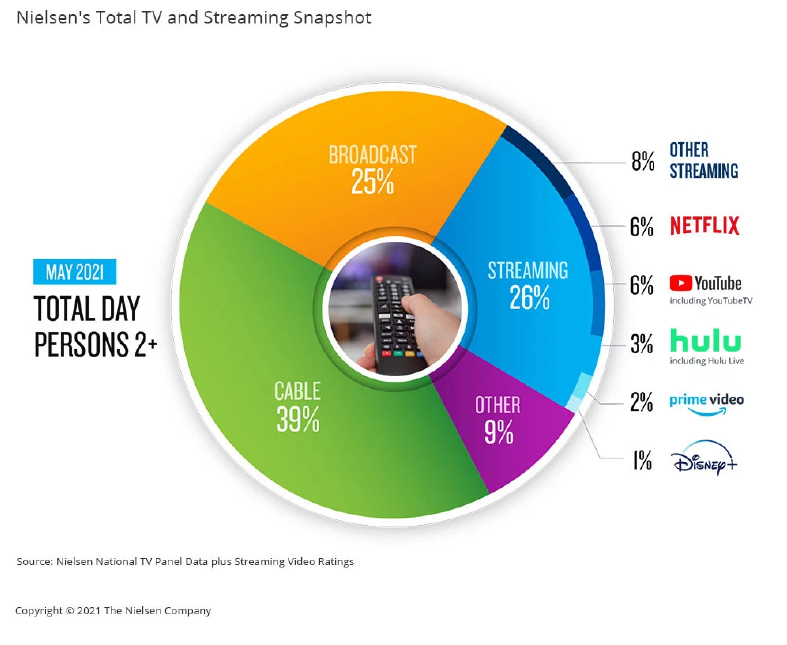
Presently cable leads the sector with 39% of all viewership. When segmenting streaming services, “Other Streaming” has the biggest share, closely followed by Netflix and YouTube. It’s important to remember that many streaming services do not air commercials. To a lesser extent, the same can be said for cable viewership.
What does this mean for advertisers? TV, which was once the mass appeal advertising outlet, is less effective than it used to be. People have shifted more of their viewing hours to streaming services and a multitude of cable channels. We’ve pointed out in the past that folks who are still heavy to broadcast TV are typically older (55+) and less affluent than the general population.
Broadcast TV is not the only advertising vehicle that has seen its share erode. However, the above Nielsen chart is more dramatic than many expected.
So what about radio? Any good sales rep should be prepared for that question. Like video entertainment, audio entertainment offerings have greatly expanded in recent years. Even though there is no comparable Nielsen chart like this for audio, radio can still put forth a strong story.
While the viewing chart takes into account time spent, subscribers can use qualitative research (Scarborough, The Media Audit, etc.) to compare the cume reach of radio listening to other audio choices. With many qualitative research options, this includes streaming services, satellite services, and podcasts. In just about every case, radio outreaches the other audio outlets.
In other words, radio has maintained its advantage against other audio outlets better than broadcast TV has maintained its advantage against other viewing outlets.
Armed with this valuable information, you can provide expert advice to your clients. Make sure an advertiser is not buying broadcast TV and expecting the mass reach it once delivered. On the other hand, remind them that radio continues to deliver a greater listening audience when compared to other audio offerings.