
Hot Topics
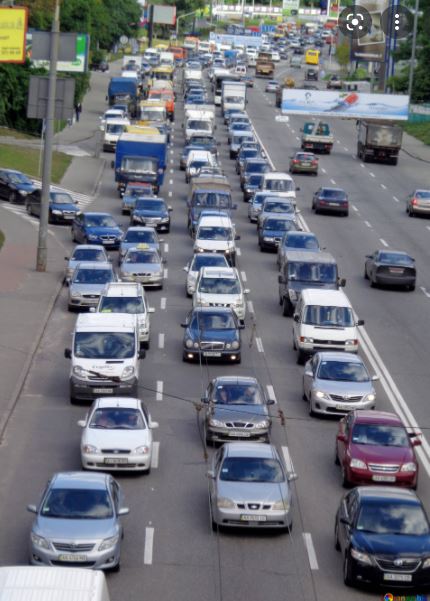
Damn This Traffic Jam
December 16, 2021
 In today’s modern PPM-encoded world, radio programmers can garner a lot of granular information on their listeners. However, one data point that eludes us is location. We can know if listening is “at home” or “away from home” but have lost the “at work” and “in car” distinctions.
How can we compensate for that missing insight?
Even though the location break-outs we got used to in a diary world aren’t available in the PPM data, we are fairly confident that most of that “away” listening is coming from the car.
We also know that the COVID-19 pandemic devastated normal commuting patterns. We could see that quite vividly in the Apple Mobility Trends Report. That same dashboard has shown that – in many cities – commuting patterns are back to pre-pandemic levels.
Then along comes this: The INRIX 2021 Global Traffic Scorecard. They are a world leader in transportation analytics and connected car services. This report identified and ranked congestion and mobility trends in more than 1,000 cities in 50 countries. Without getting too far into the weeds, the report is based on billions of data points collected on a daily basis from a variety of sources. You can download the full report here.
What it revealed is eye-opening.
The average American driver lost 36 hours due to congestion – a 10-hour increase over 2020. Here’s the kicker. That figure is 63 hours BELOW pre-pandemic levels.
For example, Boston is down 47% from pre-pandemic levels, while Los Angeles is off by 40%. Downtown trips in the top 10 most congested U.S. markets are down between 18% and 49%.
What if – maybe – our assumptions of a return to normal are faulty? This data did cover a year that was composed of different realities. In the first half, many school systems were operating remotely. In the work world, we were coming to grips with, at best, hybrid schedules. By the fall, most school systems were back in usual session, companies were beginning to bring employees back into the office, and most lockdowns had ended. If we were able to parse the data on a month-by-month basis, there is the possibility that traffic congestion was worse in October than in March.
That said, this information can explain what we are seeing in radio listening. It could be a partial explanation as to why PUMMs are slow to return to pre-pandemic levels.
It also challenges broadcasters to find ways of recapturing this lost “airtime” in other ways, placing an increased importance on the quality and customer experience of on-air streams.
Hard as it is to believe, we are about to enter year THREE of the COVID-19 pandemic. We, like our listeners, are tired of talking about it, hearing about it, and dealing with it. However, it has changed how we live in fundamental – and possibly permanent – ways.
An all-news program director once said, “All I pray for are snowstorms and traffic accidents.” Rising commute times may mean more traffic accidents, but it also creates more TSL/AWTE. We know for certain that radio continues to dominate in-car entertainment.
For salespeople, it is important to highlight this point to potential advertisers. Many went away from radio as commute times disappeared. Now that they’re back, the advertising dollars should follow.
How will radio adapt? Stay tuned.
-Steve Allan, Programming Research Consultant
Comments