Hot Topics
Sharing Is Caring
June 22, 2022
 As radio programmers, we can become obsessed with our competition. Where do our listeners go when they leave our station? As the most recent Jacobs Media Tech Survey pointed out – all too often they leave for audio sources that are not found on the radio dial.
Until we have a “one-ring-to-rule-them-all” audio measurement system, we can only track our listeners to other radio stations.
There is value in tracking listening within our own ecosystem. And there are some valuable – and easy to use – tools available for you to do just that.
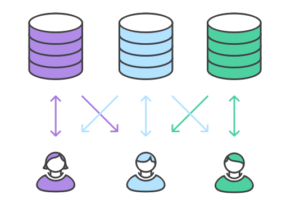
TAPSCAN Web offers two reports that can let you know which stations are duplicating your cume. Remember that cume is not additive. Listeners can cume more than one station.
The Duplication Grid report is customizable for surveys, stations, demos, and dayparts. It will provide you a grid (hence the name) that shows cume duplication in the market. Be aware that the default for stations is “Home to Metro” and that grid can be quite unwieldly.
The Duplication Analysis report is also about cume. It allows you to compare one group of stations to another. It is customizable for survey and demo. You can, for example, see how much cume is shared between your morning show and the rest of the day. This report will show you duplicated and unduplicated cume in both raw numbers and percentages.
If you are fortunate enough to have PD Advantage Web, I encourage you to become familiar with the Audience Sharing report. The subheading asks the question, “When listeners leave my station, where do they go?” This report not only shows you cume duplication but also how much AQH your cume is giving to other stations, plus daily and weekly occasions and time per occasion. It is a wealth of data. That can surprise you. Best of all – it comes as a 14-book trend.
This report is ranked by AQH, not cume. So you may find a station that has a low level of cume duplication with yours but gets more AQH from your listeners compared to a station that duplicates more of your cume.
You can gain some valuable insights from this. For example, a high duplication station with low AQH might mean that your fans punch in but don’t stay long. Conversely, a low duplication with high AQH can be the result of just one or two meter keepers.
As with the TAPSCAN Web reports, you can also find out where your morning listeners go the rest of the broadcast day.
As a general rule, any cume duplication that exceeds 20-25% is a competitor worthy of noting. If you are a music station and you share a large percentage of your cume with a news station (and vice versa), your competitive strategy may change. Same holds true if your top duplicated station is part of your cluster. To take it a step further – everything is relative. A station that shares around 20% of your cume but only 5% of your quarter hours is less of a threat than one that shares 20% of your cume and 20% of your quarter hours.
This kind of “big data” for radio has been around for a while. The information it yields provides a more complete look into how your station is performing.
If you would like help in deciphering this matrix of data, The Ratings Experts from Research Director, Inc. are fluent with numbers. Give us a call.
-Steve Allan, Programming Research Consultant
Comments