
Hot Topics
Back to Basics: Closing Ratios
April 27, 2023
 How many times have you pulled out all the stops to close a piece of business only to lose it? How do you differentiate yourself and your station from the rest of the pack? Would you like a secret weapon to close a piece of business? This weapon is Closing Ratios.
If you subscribe to Nielsen Scarborough, you can run a Shopped versus Purchased report. This report shows you how many listeners shopped (walked into the store), purchased (bought something), and the Closing Ratio (% of those who walked into the store who made a purchase). There are six retail store categories to select: Department Stores, Carpet/Floor Covering, Furniture/Mattress, Large Appliances, Consumer Electronics, and Hardware/Paint/Lawn/Garden.
Let’s take a look at a furniture store report for sample station WRDI-FM. The stores in the chart are only for demonstration purposes and this is not real data.
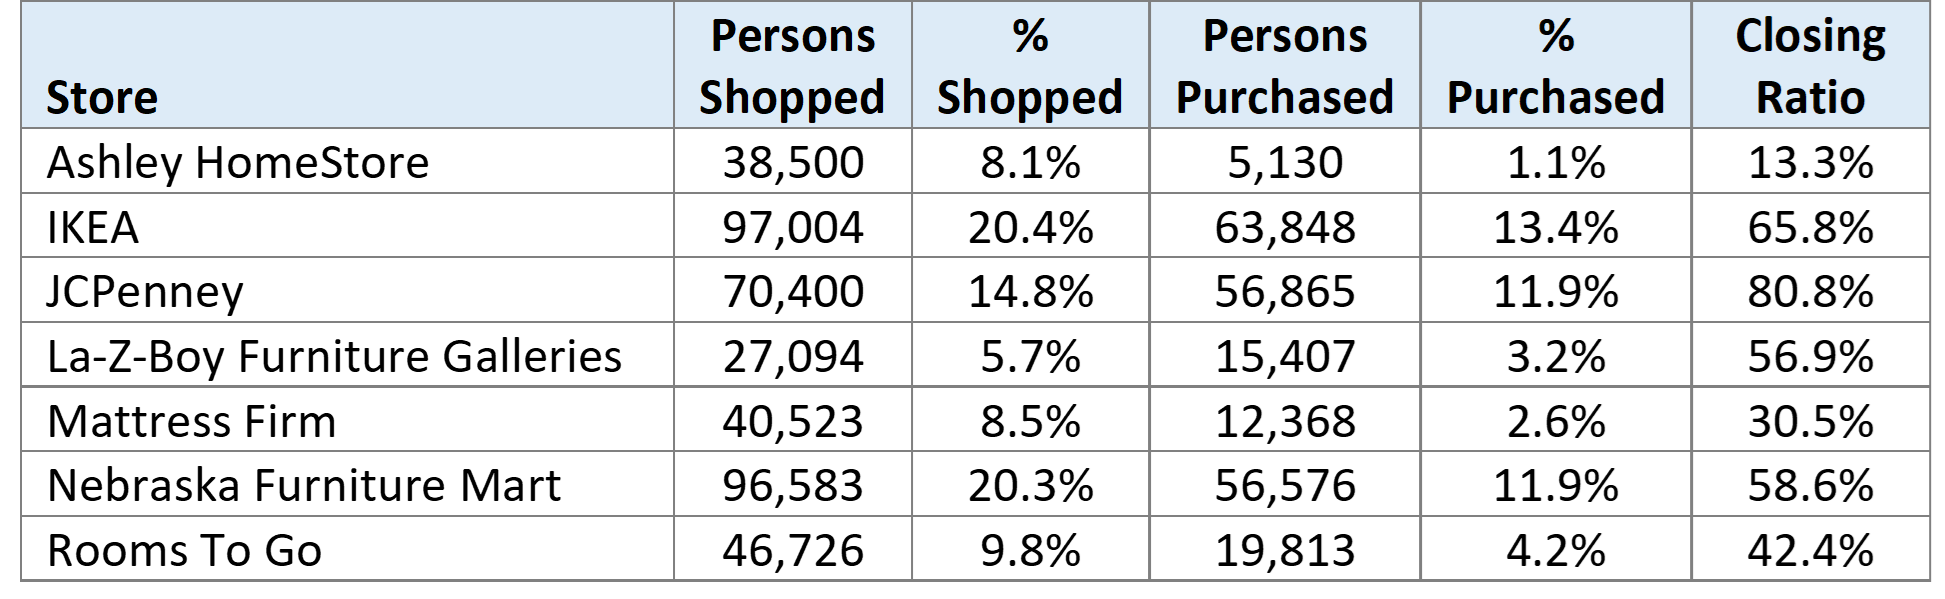
You can quickly see that different stores pop up to the top depending on which metric you analyze. IKEA shows the most shoppers and purchasers, yet not the highest Closing Ratio. Closing Ratio also demonstrates the efficiency of your audience. Fewer people need to walk into the store in order to increase sales for the store. For the JCPenney example above, “More than 8 out of 10 of our listeners who walk into your store will make a purchase.” Remember, it’s our job in radio to get people to the store. It’s the store’s responsibility to close them. Higher Closing Ratios make it easier for the store to increase sales.
There are many ways you can use the information in this report. For additional ideas and help closing more sales, contact us!
-Karen Morriss, Director of Client Services
Comments