
Hot Topics
Back to Basics: Why is Data Meaningful?
June 22, 2023
 Do you ever find yourself staring at a bunch of numbers trying to decide what is best to use? Are you looking/needing a quick way to pick the right information to use to tell the best story for your station?
Many of us find it difficult to select the right data to use in a sales pitch for a prospective client.
In last week’s blog we talked about Finding Your Best Match. Now we will be talking about the specific data used to attract that match.
When preparing your station’s story, you want to ensure that your data is meaningful. Throwing a bunch of stats into a PowerPoint deck won’t convince the advertiser that you are the best fit for their advertising.
Use the following items for selecting meaningful data to tell your story:
- Relevant
- Does it pertain to the target consumer?
- Can you tie all data points together for a fluid story?
- Current
- Is the data less than two years old?
- Always use the most recent data available.
- Shows value
- Does it relate to the advertiser’s concerns or goals?
- Don’t pre-judge what might be significant data.
- Do you need to dispel a myth or show that you exceed expectations?
- Use the right estimate
- Persons – shows actual number of people
- Percentages/Composition – focus on bulk of target
- Index – compares to the market (likelihood)
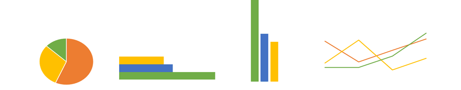
- Select the appropriate chart type that bests conveys your story
- Pie/donut – best to use with percentages when all numbers will add to 100. Example: age, gender, etc.
- Bar (horizontal and vertical) = good to use when comparing several stations.
- Line – great to use to show data over time and to compare stations.
Once you have gathered all the data that will best tell your story, and created slides in your presentation, be sure to source your data. Sourcing can be a note at the bottom of your slide which shows the details of the data including company, dates surveyed, demos, time period, geography, etc.
Tell a great story by making your data meaningful!
Reach out to us here for additional help.
-Karen Morriss, Director of Client Services
Comments