Watching the Meters
Watching the Meters
One of the key metrics when evaluating your station’s performance over time is how well Nielsen is doing, including your target audience in the panel.
Knowing how many W18-24 meters is nice but how does that compare to the market population?
Our Instant Answer report shows you that information every month.
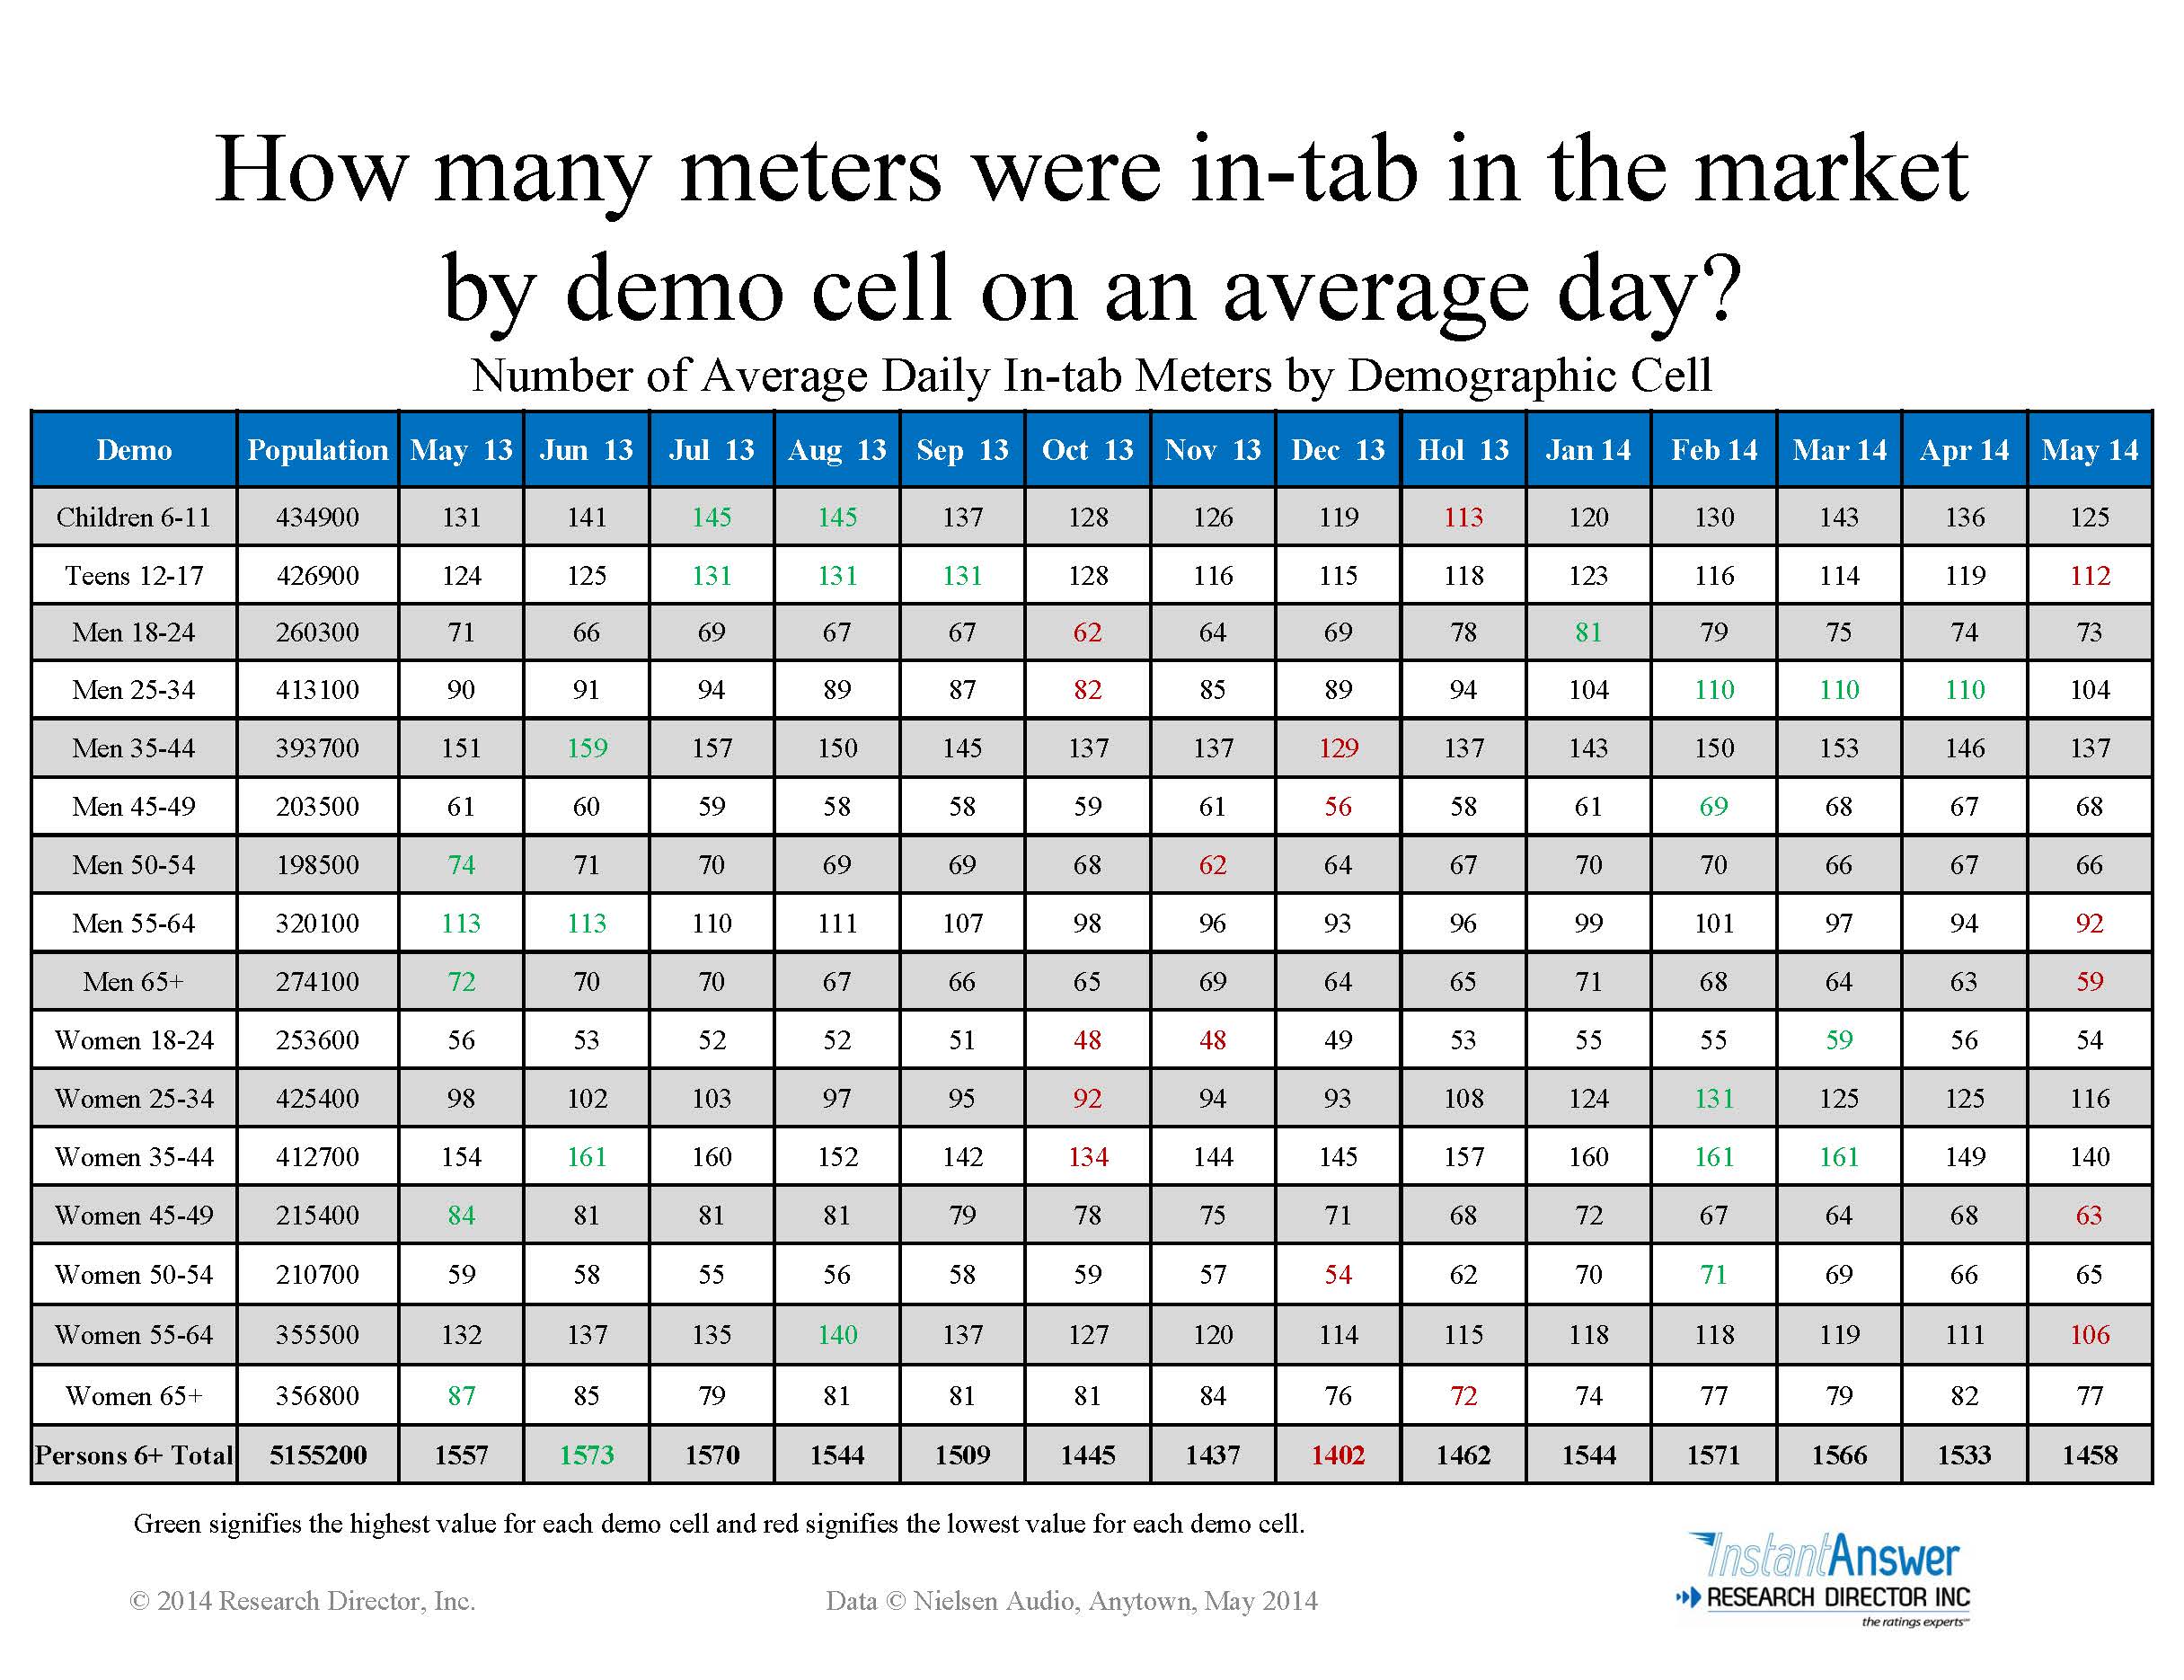
The above chart shows a market trend by demo. At a glance, you can see where the meters are increasing or declining. But that’s only half the story.
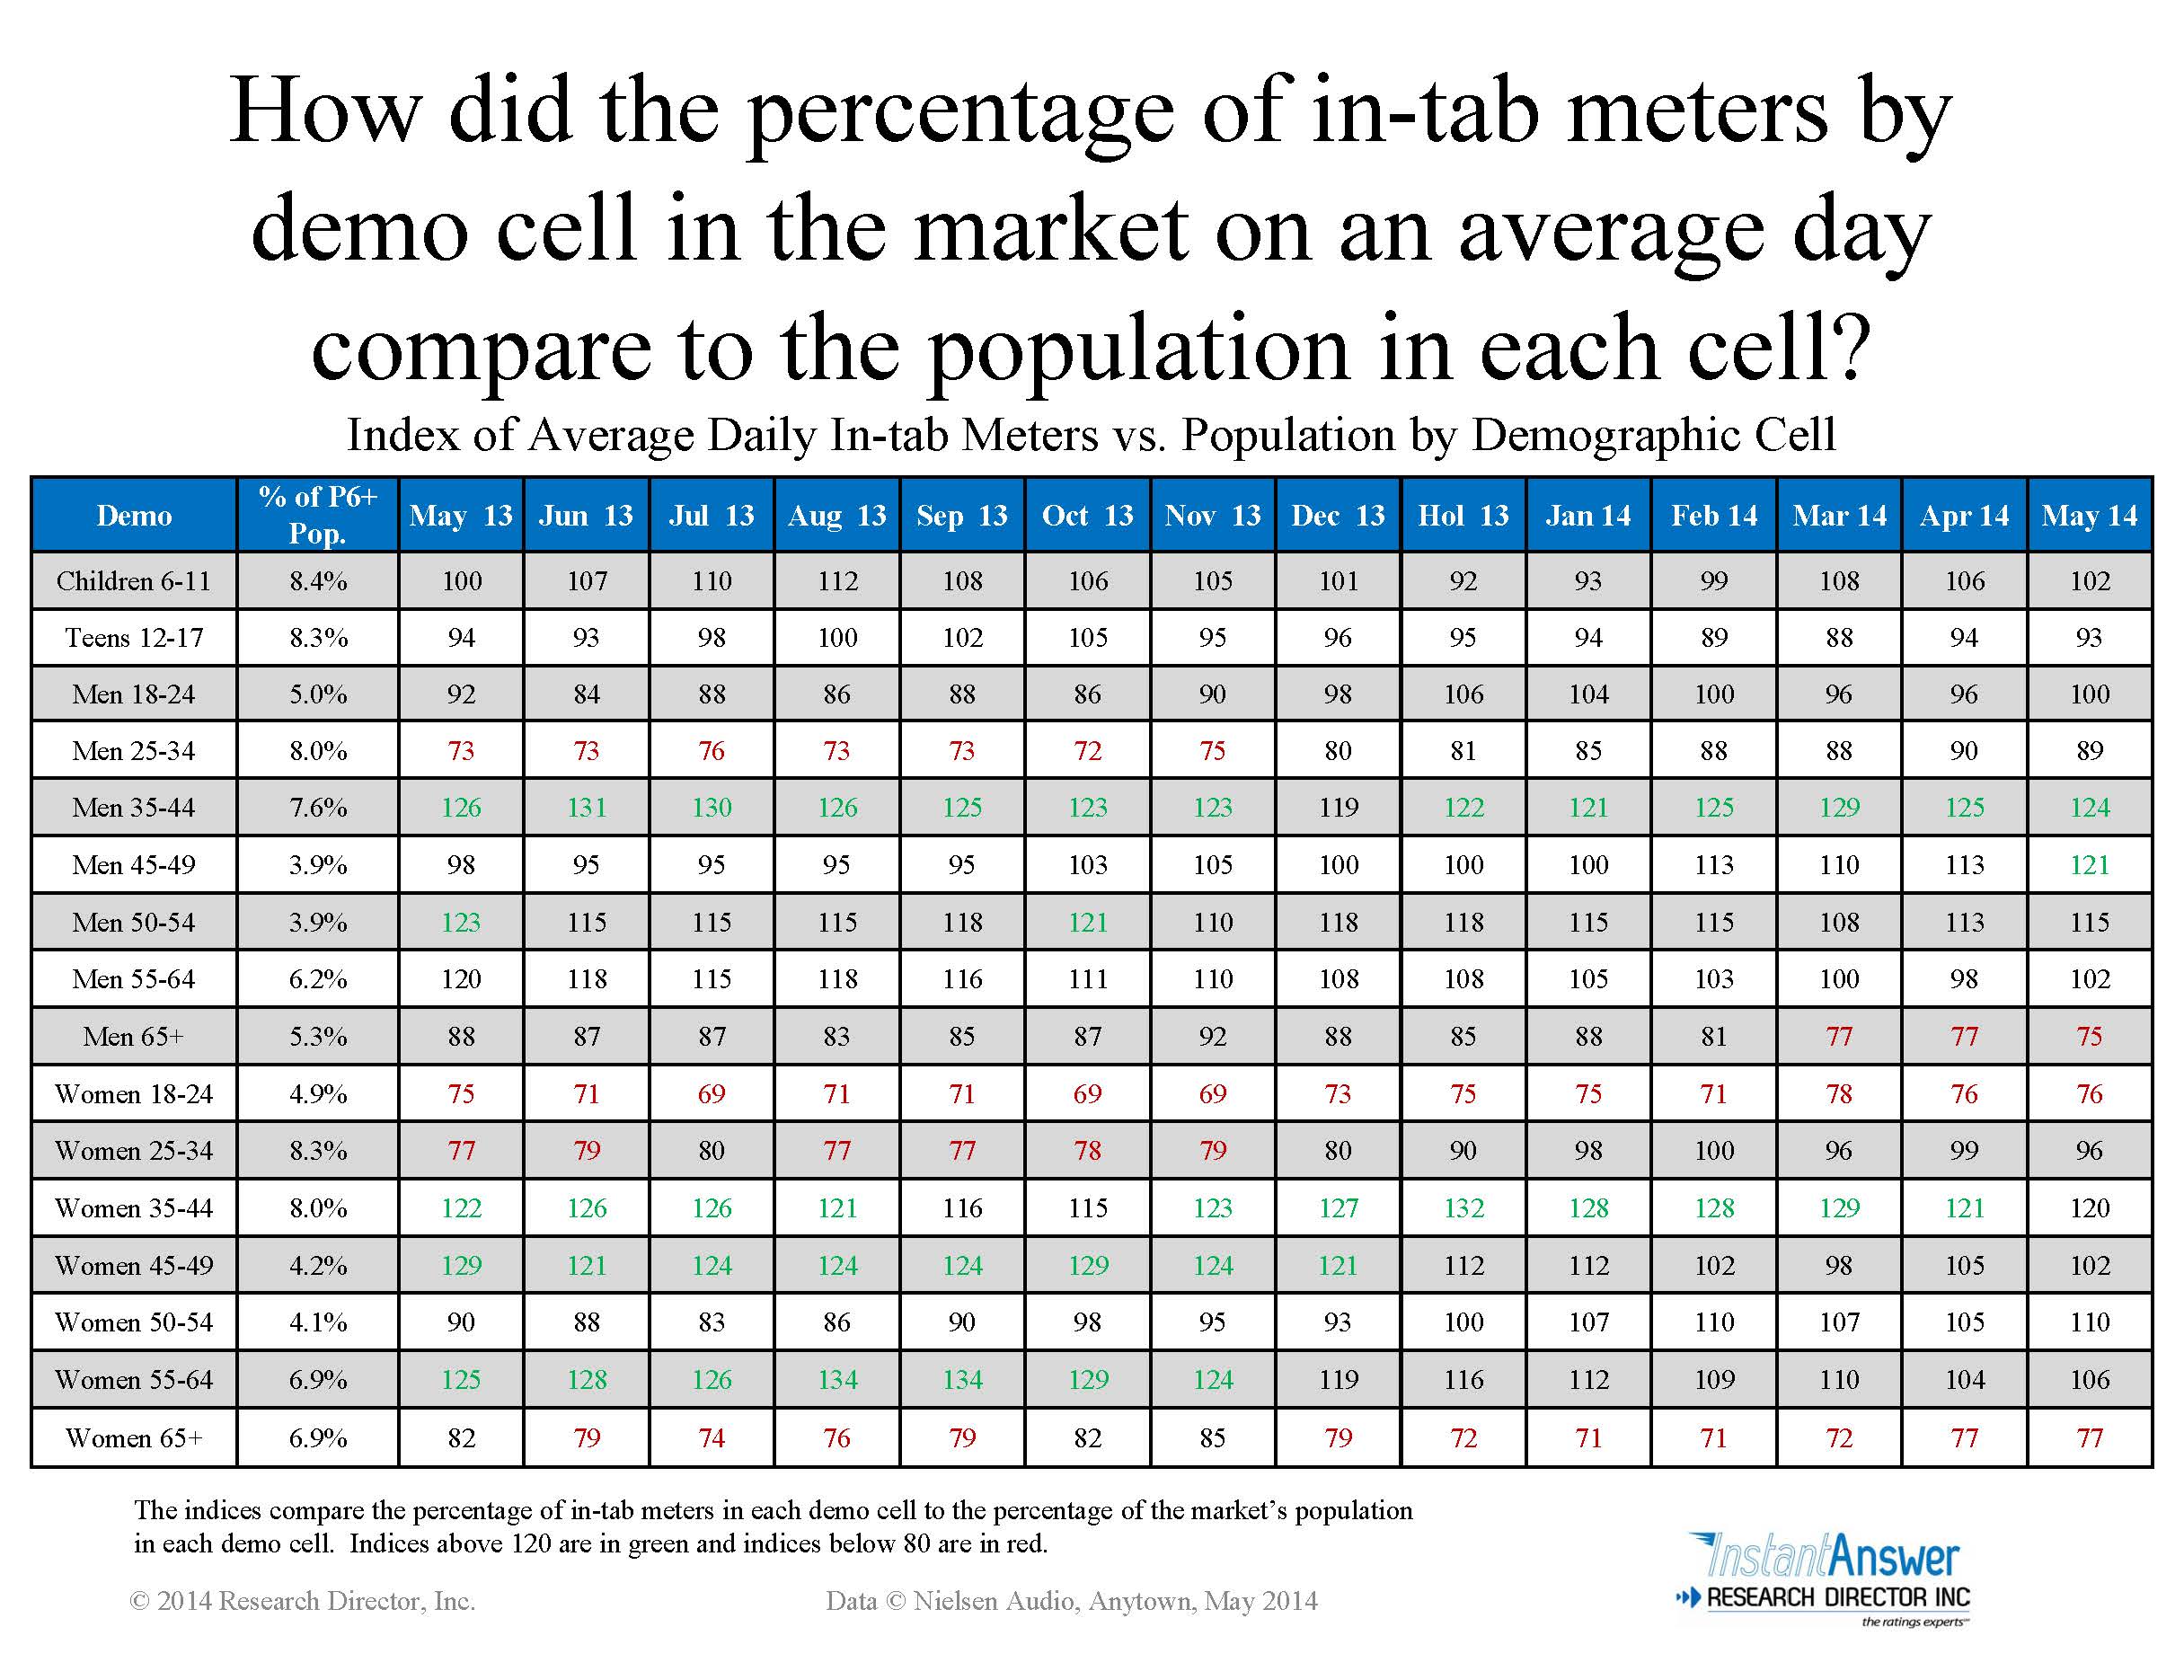
It is vitally important to know how each cell is indexing. A perfect score is 100. That means the number of meters is in exact proportion with the population. When the index goes above 100 then each meter in that demo is assigned a lower than average weight. When the index goes below 100 the weight is increased.
Knowing this information can help you make informed programming and marketing decisions. Sometimes, your decline (or growth) is a function of math – not programming.
As your partner, Research Director, Inc. watches these trends for you. In effect, we keep an eye on Nielsen performance so you don’t have to.
We can help you win in both ratings and revenue. Fill out the form below to find out more about the services offered by Research Director, Inc.