We know where they live.
We know where they live.
What could you do if you knew which zip codes were giving you the most quarter hours?
Our exclusive Hot Zip Report will show you where the active meterkeepers live – by demo, by format – whatever you choose to look for.
First, you can see how each station in the metro breaks out by zip code – AQH, share, cume, rating, and TSL. It looks something like this:
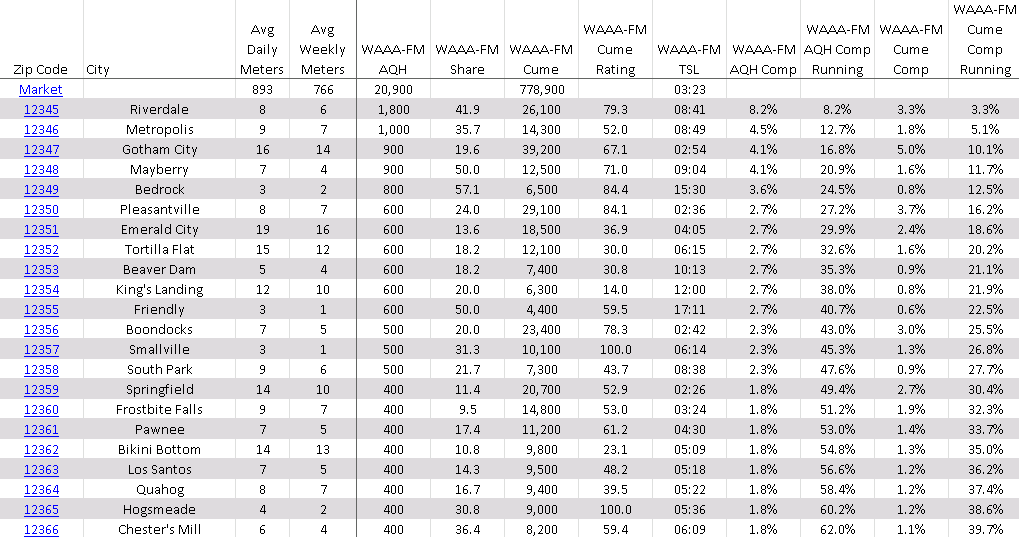
But wait – there’s more!
What could you do if you knew where all the AQH to your format was coming from?
What could you do if you knew exactly where your competition was beating you?
The Hot Zip Report goes beyond what you see above and digs deep into your specific situation in your market. In short – it helps you win.
With the Hot Zip Report, you can precisely target your marketing efforts, refine your promotional efforts, and even help your sales and programming departments.
You will see where you are strong and where there may be opportunities for growth.
All in one simple, easy to read, and pleasantly priced report.
For more information on how you can obtain a Hot Zip Report for your station or cluster, just fill in the form below. Oh, one caveat – you must be a Nielsen Audio subscriber to see this data.
(PLEASE NOTE: You must be a Nielsen Audio subscriber in good standing. Your Market Manager or Operations/Program Director will need to submit an authorization form to Nielsen that allows us to access your data. In some cases, you could incur a sales tax charge from Nielsen for allowing RDI to access the data. Contact us for more information.)