
Hot Topics
Back to Basics: Don’t Be Duped
September 8, 2022
Duplication Reports – Part 1
Have you ever wondered what “duplication” really means? How is it used in the Radio industry? What do all the terms in duplication reports mean and how can I use this information? We use lots of abbreviations and terms, yet we may not always have a full understanding of their meaning.
In this month’s Back to Basics post, we unpack and explain Duplication Reports. Keep reading to get the skinny on this vital tool in your ratings toolbox.
Duplicated audience refers to the percentage of one station’s cume audience that also listens to another station during a specified daypart. Simply put, duplication can be thought of as shared listeners between two stations. These listeners spend time with more than one radio station.
In Nielsen’s Tapscan software you will find two duplication reports: Duplication Grid and Duplication Analysis.
- Duplication Grid is the quickest way to learn what other radio stations “share” your listeners by providing a grid showing percent of audience that is shared between two radio stations.
- Duplication Analysis allows a more in-depth look at your shared audience, including additional information.
Duplication Grid
Here is a sample Duplication Grid. If you click on your call letters in the column heading of your duplication grid report, your station will move flush left and sort in descending order of % duplication.
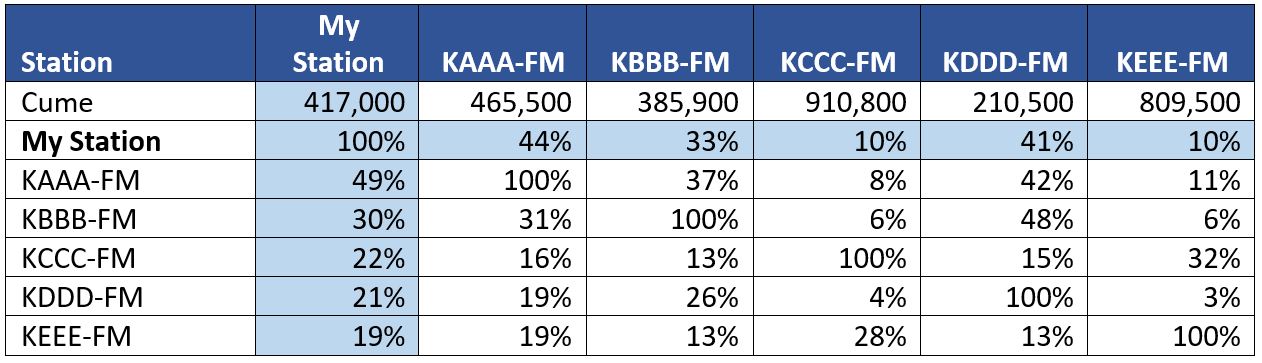
There are two ways to read this data.
- Read DOWN the column. This focuses on the station listed in the column heading by looking at the % of listeners that also listen to other stations. In this example, My Station reaches (Cume) 417,000 people. Of these people, 49% also listen to KAAA-FM, 30% listen to KBBB-FM … and down the column we go. Now you know the top stations with which you share audience.
- Read ACROSS the row. Here we are looking at the portion of other stations that our station can deliver. In the above report, My Station also reaches 44% of KAAA-FM’s audience, 33% of KBBB-FM’s audience, and so on.
What should you be looking for? Are there benchmarks for the amount of duplication or shared listening that is considered good or bad? Here are some guidelines for consideration:
- A general rule is that any station in which you share 20% or more of your audience is considered to be a competitor and needs to be on your radar.
- High duplication will increase the Frequency of your advertising message because there is a greater chance they will hear the ad on several stations.
- Low duplication will increase the Reach of your advertising message as there is less shared audience between stations … more unique listeners.
In the next issue of our Back to Basics blog we will take a deeper dive into the Duplication Analysis report. In the meantime, go pull a Duplication Grid to determine your top stations shared and get a bigger picture of how your listeners engage with your station and other radio stations.
For additional information or help to find your best stories, reach out to us here.
-Karen Morriss, Director of Client Services
Comments